spectrum is shown below. The experimental masses are shown in blue while
theoretical predictions are in black.
spectrum is shown below. The experimental masses are shown in blue while
theoretical predictions are in black.
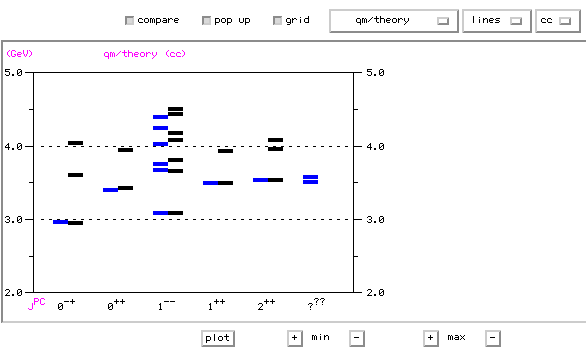
SV is a Java tool for plotting and accessing spectrum information. An
example of it as applied to the
spectrum is shown below. The experimental masses are shown in blue while
theoretical predictions are in black.